I recently got curious about what happens to the runtime permissions state when the user revokes or grants a permission using the OS Settings app, rather than allowing or denying in the dialog prompt that an app can show to request permission.
For background, there are two parts to the state that an app can query at any time:
shouldShowRequestPermissionRationale() returns true or false. True means that the user has previously denied your request for this permission, so you should explain to the user why your app needs this permission. This returns false if the user denies the permission and checks the “don’t ask again” box.
The question I got curious about was this: what happens when the user revokes a permission in the settings app? If they had previously chosen “don’t ask again”, but then later grant the permission in settings, then revoke the permission again, can you prompt for the permission?
I made a simple app to try it out, and came up with this for the possible states:The answer is that if the user revokes a permission in settings, all of that history essentially goes away. You’re left in the same state as if you had asked for permission and the user had denied it once, but you can ask again.
I realize this isn’t the sort of thing that’s going to happen in the course of normal usage; I don’t expect most users to ever toggle those permissions from the settings app. But I think it’s worth understanding how it works.
Every year as state legislative sessions get started, there’s a flurry of scary headlines of the form: “[State] [Party] files bill to do [thing I find scary, bigoted, or irresponsible]”. It’s tough to know from reading whether this is something you should get concerned about.
Good reporting can help to fill this in – is this a senior legislator, are they a known kook, etc. But there’s another, more general piece of this context that I wanted to help fill in. My question is, overall: how often does a bill go from being filed (its first official step) to becoming law (its final official step)?
First you need at least a rough understanding of how a legislature works. You could watch the classic Schoolhouse Rock video:
Or I’ll give you the 60-second version (skip to the next paragraph if you already know how it works): a legislator files a bill, which is a thing that they want to become law. The person who files is called the “sponsor” or “patron.” It’s referred to a relevant committee, which is made up of a subset of the legislators in their chamber (the House or Senate, usually). If a majority of the members of the committee vote for it, then it goes to the full chamber, if it gets a majority vote there then it’s handed over to the other chamber, and the committee and full-chamber process repeats. After that, the governor signs the bill then it becomes a law. (Exact details vary by state, but it’s probably pretty close to that, unless you’re in Nebraska. Find your legislature’s website and they probably have a “how a bill becomes a law” page to explain their version of the process.)
The important thing to know is that bills can (and do) fail at any of those steps in the previous paragraph. Depending on the rules of the chamber, if the leadership doesn’t like the sponsor, or the bill, it may never even come up for a vote. Or those votes will happen in a closed session of a subcommittee, where the public doesn’t get to see which legislators voted to kill a bill.
Back to the point, I downloaded the history of every bill filed in the North Carolina General Assembly (NCGA), my state legislature, since 1985 and parsed out its fate. The answer to my question was 23.6% — just under a quarter of our bills actually become law.
So when you see that scary headline, keep in mind that a bill being filed is actually more likely to fail without becoming law, than to succeed. I’m not telling you to ignore it, or not to fight it — on the contrary, this should encourage you to fight. Be part of the reason that the bill you don’t like failed. Get out there and kill that bill.
I’m sorry, I had to. I don’t even like this movie, but the pun was just sitting right there.
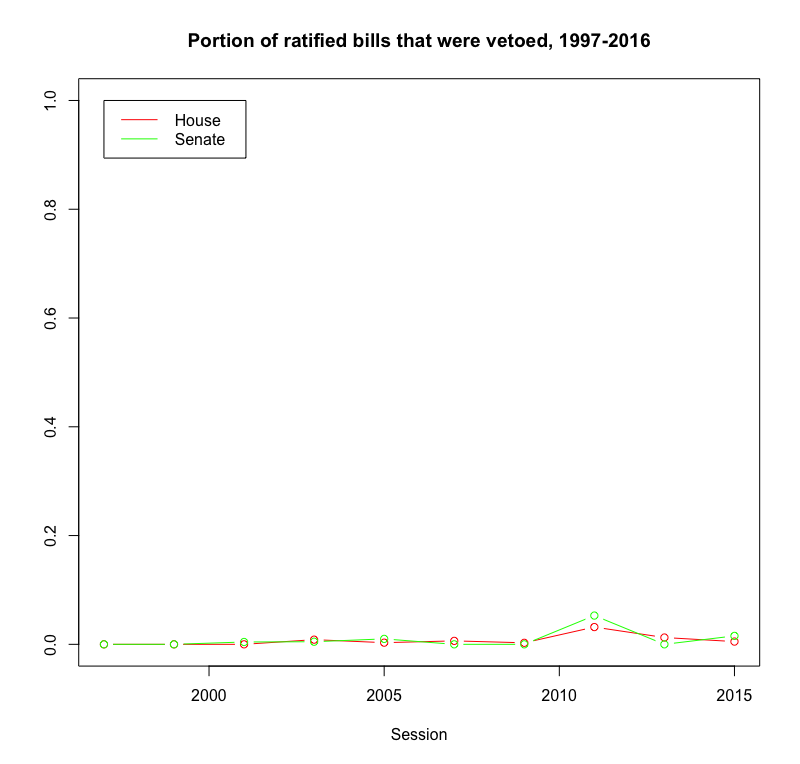
Since I’ve got all this data, I decided to answer another question quickly: how often does the governor veto bills? This next chart shows how often, when given the option to sign or veto a bill, the governor chose to veto:
So, uh, not often. There’s a tiny little spike in the 2011-2012 session, when we had a Democratic governor and a Republican-controlled legislature, but even then it barely registers on the chart.
If you got this far and you think this was at least a little neat, I want to do something for you. I’ve got all this data downloaded and parsed, and I’m sifting through it, but I want to know what questions I should try to answer. Here are a few that I want to tackle next:
a breakdown of where bills fail – in committee, in the full chamber, in the other chamber.
which legislators get more of their bills passed?
are bills with more co-sponsors more likely to pass?
Can you come up with others? If you have a question or a hypothesis, tweet it at me @jebstuart and I’ll see if I can answer it.
Following are a few notes about methodology & assumptions:
Why start in 1985? That’s as far back as the easily-available online records go (and almost my full lifetime) so I’m calling that “the relevant dataset”. I feel like it’s enough data to get a good sense of the overall pattern.
Why are there only data points every other year? The NCGA operates in two-year sessions (e.g. we’re currently in the 2017-2018 session), and that’s how their bills are filed.
What about resolutions? An NC legislator can file a “bill” or a “resolution”, but resolutions are typically honorary things without legal weight, so I excluded them from the dataset as not relevant to the question I wanted to answer.
What about “extra” (or “special”) sessions? I didn’t include them either. They’re typically single-purpose sessions with few bills filed, and I didn’t want to clutter the data.
Are the numbers the same for [other state]? Not the exact same, for sure. Maybe similar, maybe not. I have a hunch these results are probably “typical”, within a standard deviation or so, but I can’t verify that without a lot of work that I’m not going to do.
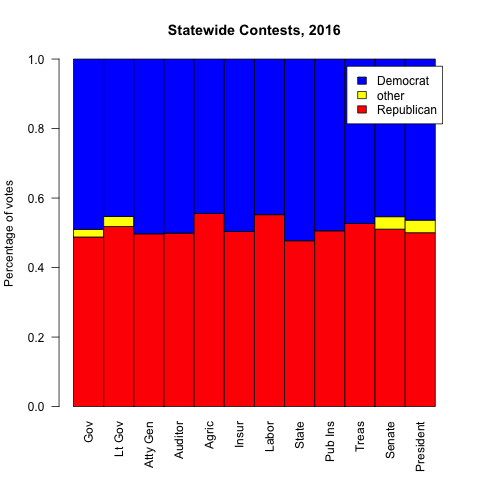
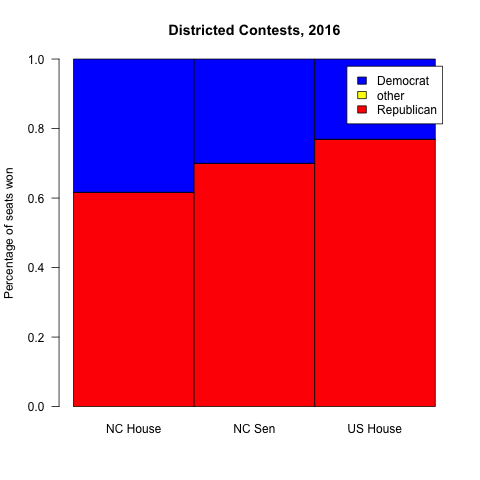
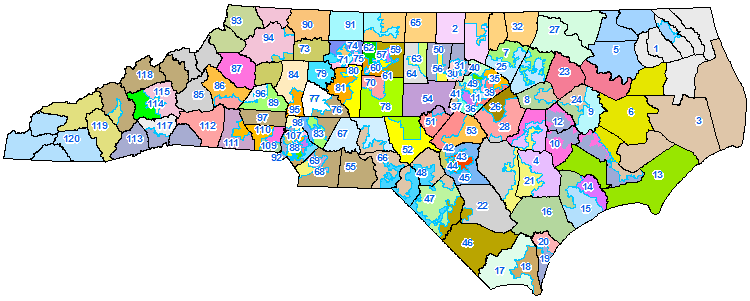
I moved to North Carolina in 2011 and, as I’ve come to learn more about our politics, I’ve been struck by something that seems impossible: North Carolina has two separate realms of politics. In statewide elections, NC is split pretty much 50/50 between the two major parties. But in races where the state is split into districts, like the state legislature, the Republican Party controls a supermajority of seats (over 60%). With over 60% of the seats in the NC House and Senate, the Republicans can override the Governor’s veto, severely limiting the executive’s power.
In the first chart are the statewide races – some are won by Democrats, some by Republicans, but they’re all within a couple percent of 50/50. In the second chart, we see the various districted houses in North Carolina, and all of them have 60+% Republican wins. I’ve spent much of the last year puzzling over how these two types of elections could produce such different results from the same voters. My background is in computer science and math, so I’ve tried to find an answer to this question the best way I can: using data.
Our state legisIature, the North Carolina General Assembly (NGCA), is elected every two years, as are our Congressional representatives. The US President and our statewide offices (Governor, Lieutenant Governor, Attorney General, etc) are every four years, and US Senators are every six years. So we have a lot of data to work with. I started by downloading the raw election result data for each of the previously-mentioned races for the last fifteen years from the State Board of Elections. (Before 2002, the data gets harder to access and less detailed).
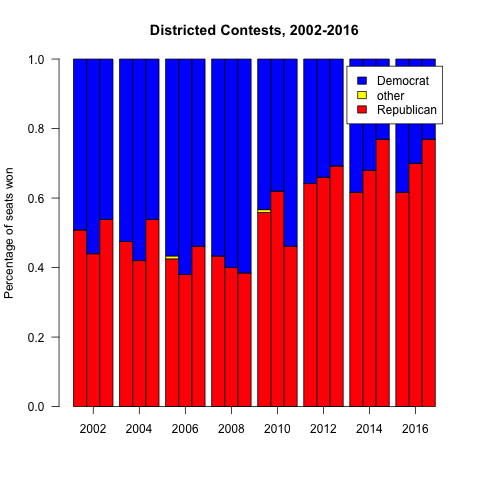
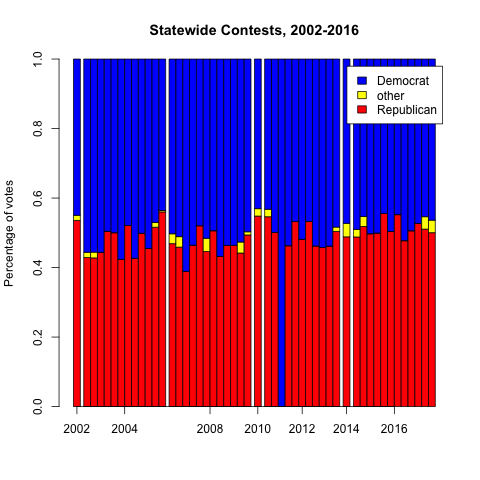
What I found is that, before I moved here, elections weren’t quite so lopsided. Clearly something changed, abruptly, between 2010 and 2012. I don’t think it was me moving to Charlotte. More importantly, it wasn’t that the electorate faced a massive shift between parties — if you look at statewide elections, the party splits stayed roughly the same. There’s some variability as you look at individual races, but you see they’re mostly within the 45-55% range.
So what changed?
These changed. Following the 2010 census, as happens after each census, district boundaries are redrawn in order to rebalance the shifting population across the districts. But in 2010, the Republican Party had just won control of the NCGA, so they got to control the redistricting process – the prior maps were drawn by a Democratic Party controlled legislature.
Now it’s important to understand how strategic redistricting works. If you want to skew the district map to your party’s advantage, you create a small number of districts with as many of your opponent’s voters as you can cram in (“packing”), and a larger number of districts with just enough of your voters to reliably win (“cracking”). If you’re unfamiliar, I’d recommend taking a minute to read Wikipedia’s primer, which has some helpful examples of why this is so effective. Also, fun fact, the first district they show as an example of egregious gerrymandering is the district I was in when I first moved to Charlotte, the NC-12th.
In any election, 49% of the votes are “wasted” — that is, they don’t contribute to the election of a candidate. This includes all of the votes for the losing candidate, and all of the votes for the winner past a simple majority. If you pack and crack effectively, you can skew the districts so that your party wastes fewer of its votes, and your opponent wastes more of their votes, and you can create a map where a 50/50 citizenry elects a supermajority of one party.
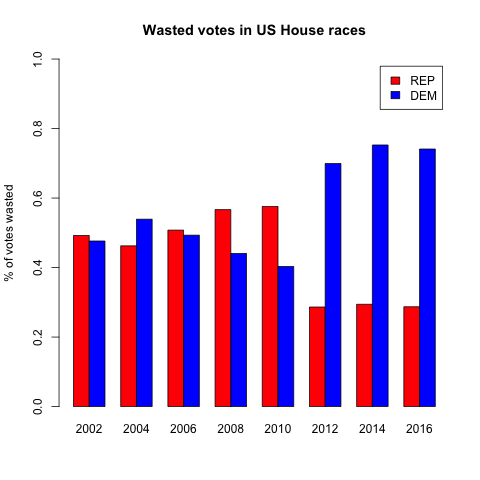
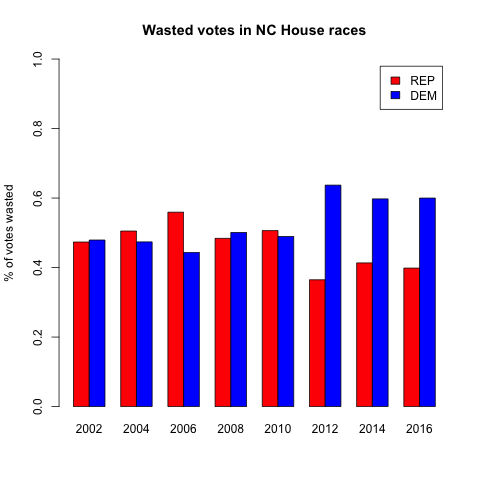
So the goal of gerrymandering is to waste as many of your opponents votes, and as few of your own votes, as possible. Let’s see if we notice any change in wasted votes after the 2010 redistricting. To keep the chart easier to read, let’s start with just one district map – the NC House of Representatives. Let’s look at the percent of votes that each party wasted.
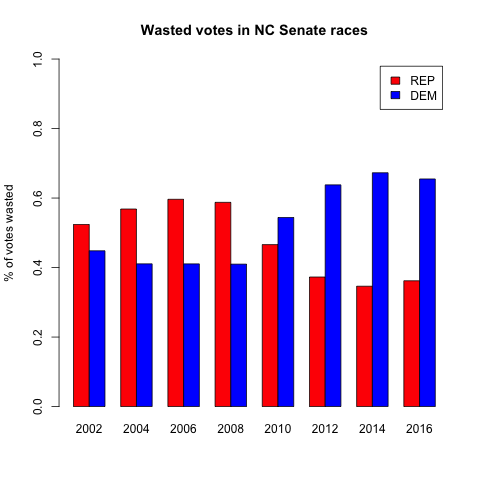
There it is — a pretty clear jump between close margins in 2002-2010, to very lopsided vote wasting in 2012 and later. And lest you think I cherry-picked the worst map, I actually chose the least dramatic. The NC Senate and US House results are even more lopsided.
In case you’re not a chart person, here’s what that last one says — since 2012, the Congressional maps have been drawn so that over ⅔of Democrats are wasting their votes, and less than ⅓ of Republicans.
If you look at all of the elections 2002-2010, the highest percentage of wasted votes that any party had was 59.6% (Republicans in the Senate in 2006). In every single election 2012-2016, the Democrats have wasted more than that. It’s impossible for me to overstate that sharp division. Every single election since 2012 has been more skewed than the worst outlier of the decade before. Every single election since 2012 has been less fair than all of the elections of the prior decade.
Back to my original question – how did we end up with 50/50 elections for governor, but a legislature that’s had 60% or more seats go to one party, the same party, in every election since 2012? The best answer I have for that is to look at the districting. I believe that the data show that the districts were drawn to systematically favor one party by wasting more of their opponent’s votes.
Now that you know how to run a man-in-the-middle attack, you want to know how to prevent one. The way we’re going to do that is by “pinning” your certificate.
How does it work?
HTTPS begins its connection by verifying the certificate that’s being presented by the server. It checks all of the signatures in the chain of trust, and that the root certificate authority (CA) is any one of the trusted roots installed in your OS. What we do with pinning is to add one more check — the client checks that one of the certificates in the chain of trust is exactly the certificate it’s expecting.
The man-in-the-middle attack that we ran relied on installing a bogus trusted root CA in the operating system, which mitmproxy used to create a bogus chain of trust. But if you’ve pinning the real certificate, this attack fails because mitmproxy can’t issue a bogus certificate with your server’s real key.
OK let’s do it
OkHttp3
Set up a certificate pinner on your OkHttpClient with a dummy signature for your domain:
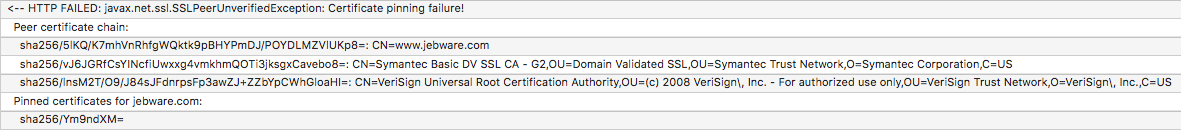
Run with that certificate pinner, you’ll get an SSLPeerUnverifiedException showing the expected hash (your bogus one) and the actual hashes for each certificate in the chain.
Replace the bogus hash in your code with the hash of the certificate you want to pin, and run it again.
Now try running with mitmproxy again to verify that it fails.
OkHttp2
Same steps as above, but here’s the code for your dummy pinner:
Let’s talk about some of the things you need to think about:
Renewals – certificates aren’t forever
When you look at any of the certificates in your chain, you’ll notice that they all have expiration dates. Sometime before that expiration date, your system administrator is (hopefully) going to renew that certificate – that is, they’ll get a new certificate for your server. If you’re not planning ahead and talking to your sysadmin, this could break your connections.
Pin the whole certificate or just the public key?
If you were manually verifying the certificate, you might think of hashing the whole certificate and ensuring that matches your expected value. That’s going to be brittle, because if the certificate gets renewed and you’re pinning to the entire certificate, your pin is going to break.
So in the example above, OkHttp is pinning the public key info, not the whole certificate. So if the certificate gets renewed and the new certificate has the same public key, your pin should continue to work fine.
Which certificate in the chain to pin?
You can pin any of the certificates in your chain of trust – the root CA, and intermediate CA, or your server’s certificate. Let’s look at some pros and cons of each.
If you pin one of the CA certificates, then as long as your server gets a new certificate from the same CA, it doesn’t matter if your certificates public key changes. This is potentially useful if your server is hosted by somebody else and you might change providers. The downside is you’re locked into that CA. You have to get your renewed certificate from the same CA, and their public key has to be unchanged.
On the other hand, if you pin your server’s certificate, then you can get your renewed certificate from any CA you want, as long as your server’s public key is unchanged.
Bottom line: talk to your system administrator to ensure that your pinning won’t break when they renew the certificate.
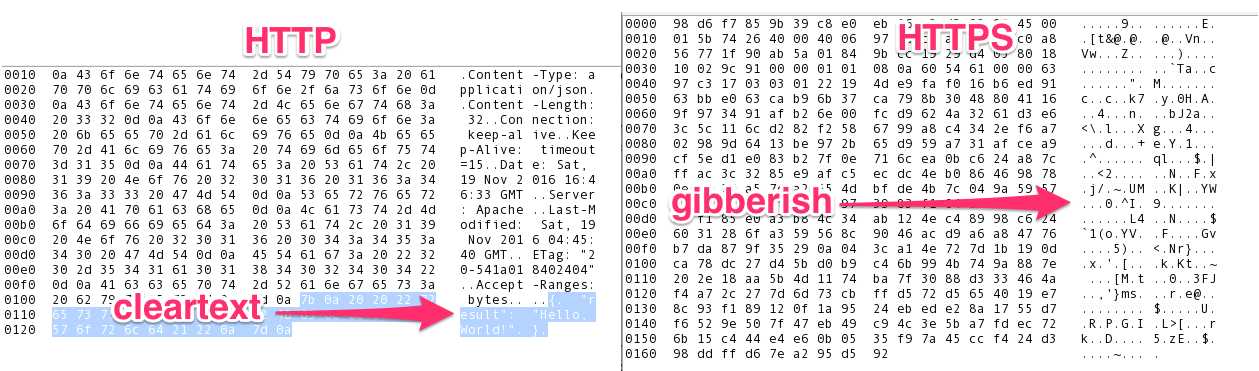
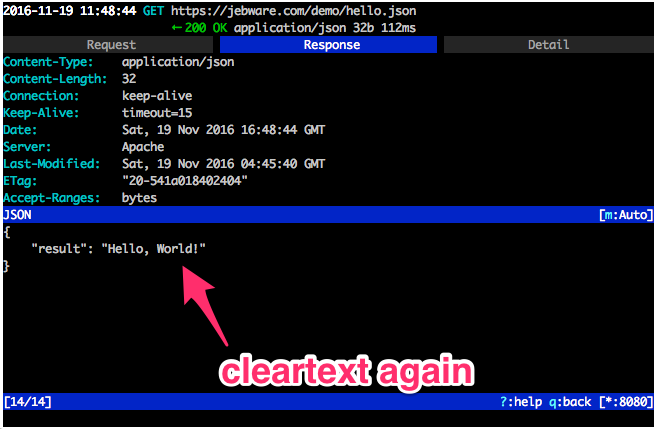
If you want to see the actual traffic you’re sending over the network, for debugging purposes.
See what third-party libraries might be sending, and how they’re sending it.
Demonstrating how trivial it is to do so, as a pre-condition for mitigating it.
But I’m using HTTPS, so I can’t MITM my traffic.
(side note: any day I can use an Independence Day GIF is a good day)
Yes, by using HTTPS, a random third-party can’t decrypt your payloads.
But while HTTPS protects you from a third-party listening in to your traffic, the endpoints are still vulnerable.
I don’t want to get sidetracked with a detailed explanation of how HTTPS protects you, so here’s the short version: First, you verify the server’s identity using the Public Key Infrastructure. The server presents a certificate saying “I am example.com”. That certificate has been signed by a trusted third-party, called a Root Certificate Authority (CA). That signature says “I am Trusted CA, Inc. and that really is example.com”. Your OS has a couple hundred root CA certificates installed, so it can be sure that it’s really Trusted CA, Inc. that signed the certificate. (In reality, the server’s certificate has actually been signed by an intermediary CA, which was in turn signed by the root CA. We call this the chain of trust).
After you’ve established the server’s identity, you exchange public keys, and can encrypt messages to each other that can only be decrypted by the known party – no third party can listen in to your encrypted messages and see what you’re saying.
Since we can’t decrypt your HTTPS payloads, we’re going to attack by making a fake root CA and installing it as one of the device’s trusted roots.
Isn’t that hard?
Nope. We’re going to install a tool that handles it all for you.
Step 2. Run mitmproxy on your dev machine. Down in the bottom-right corner, it’ll tell you what port it’s running on. Also, make note of your dev machine’s IP address.
Step 3. Connect your Android (or iOS or whatever else) device to the same network as your dev machine, and in your network settings, set your proxy to your dev machine’s IP address and the port that mitmproxy is running on. The exact details of how to do this vary by OS version, so’ll have to google that for yourself.
Step 4. On your target device, open a browser and go to (mitm.it) This magic domain will help you install mitmproxy’s certificate as a trusted root CA on your device.
Step 5. Run your app, and watch mitmproxy dump all of your traffic.
Your sysadmin comes to you and says “hey, let’s quit using the developmestruction environment, I set up this new test server we can test with instead.” Awesome. This is definitely a good thing for your development.
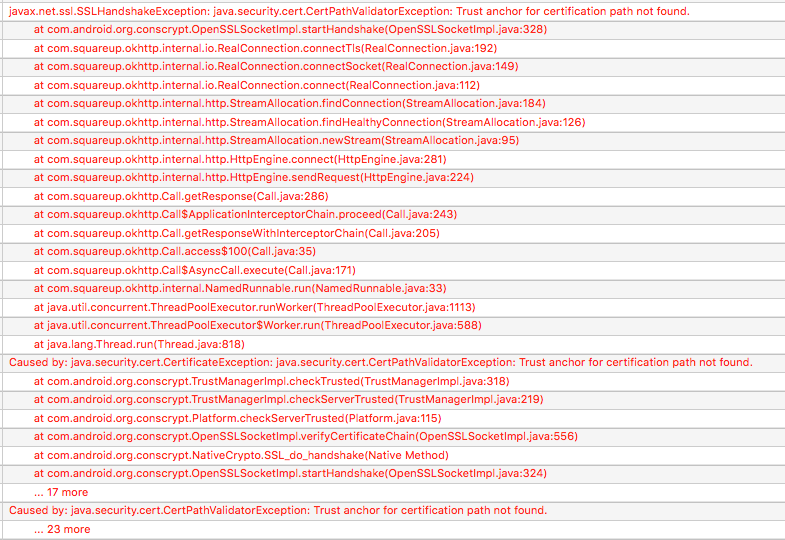
So you switch the URL your app is calling, but now you’re getting see this:
Why can’t you connect? Well, SSL certs cost time and money, so a lot of times in internal test and development environments you’ll see self-signed certificates. By default, OkHttp isn’t going to trust those, since they aren’t signed by a known, trusted Certificate Authority (CA).
At this point, you may find some StackOverflow answers suggesting that you make a dummy TrustManager that just blindly accepts any SSL certificate. Don’t do that. You may as well disable SSL at that point, because anybody can run a man-in-the-middle attack to read and/or manipulate your traffic. Seriously, just don’t. Even for your test environment.
The good news is, it’s just as easy to fix the right way by adding trust for your self-signed certificate. Here’s all it takes:
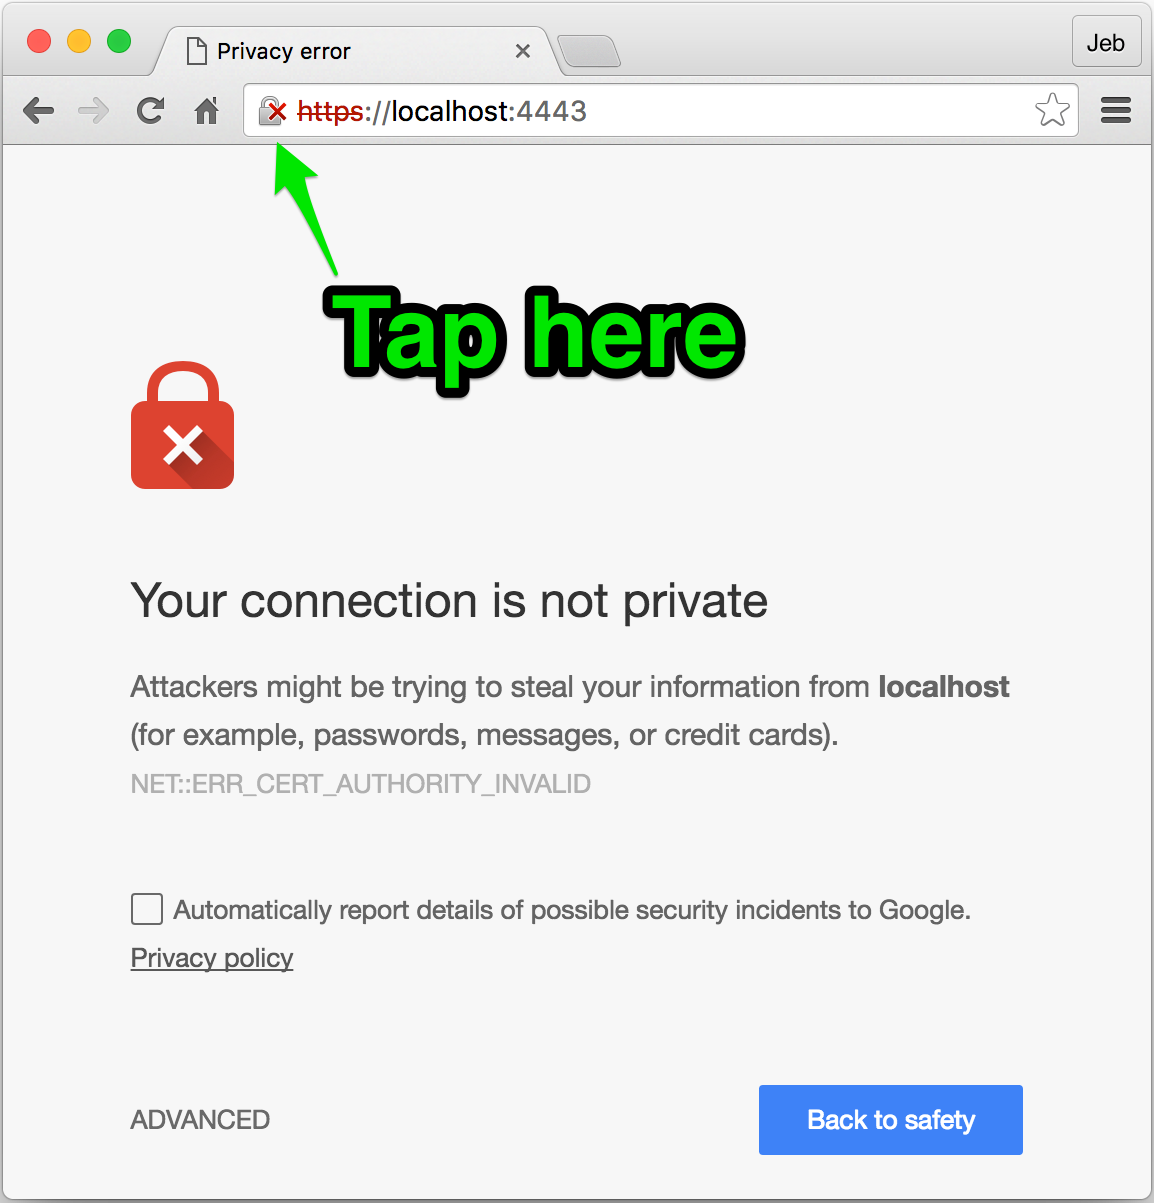
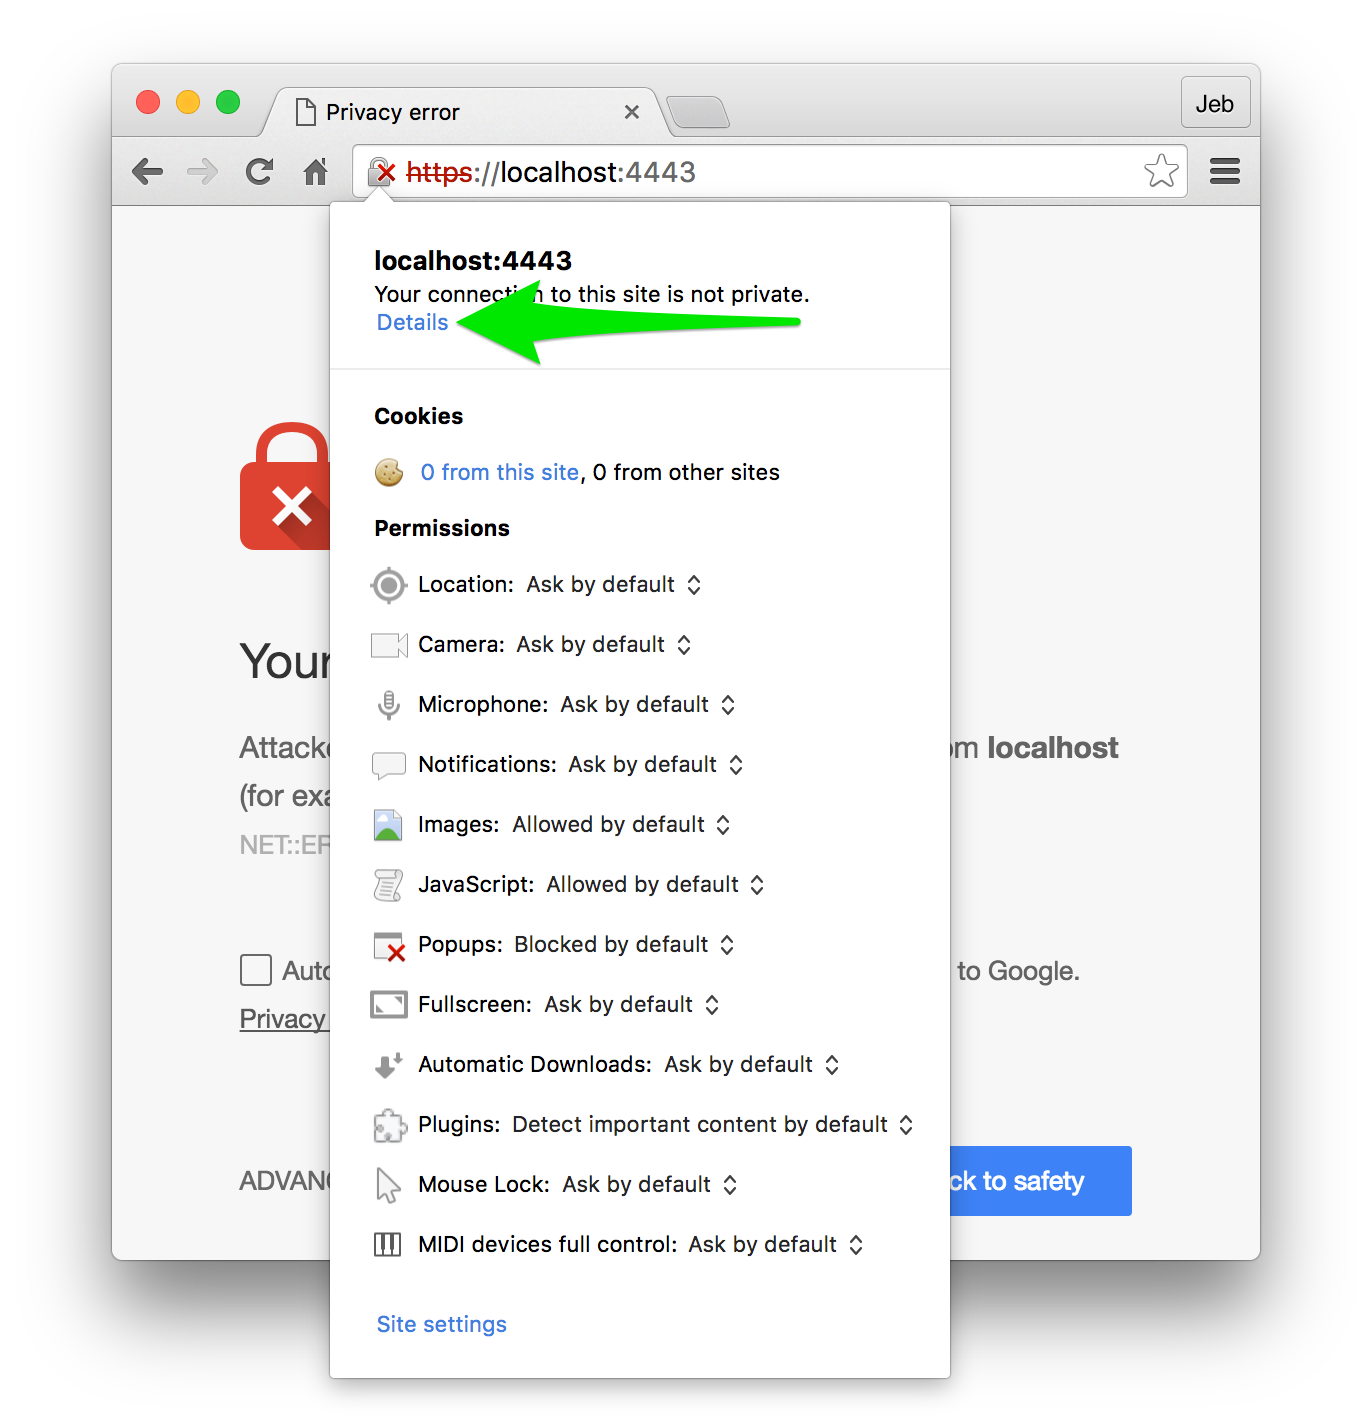
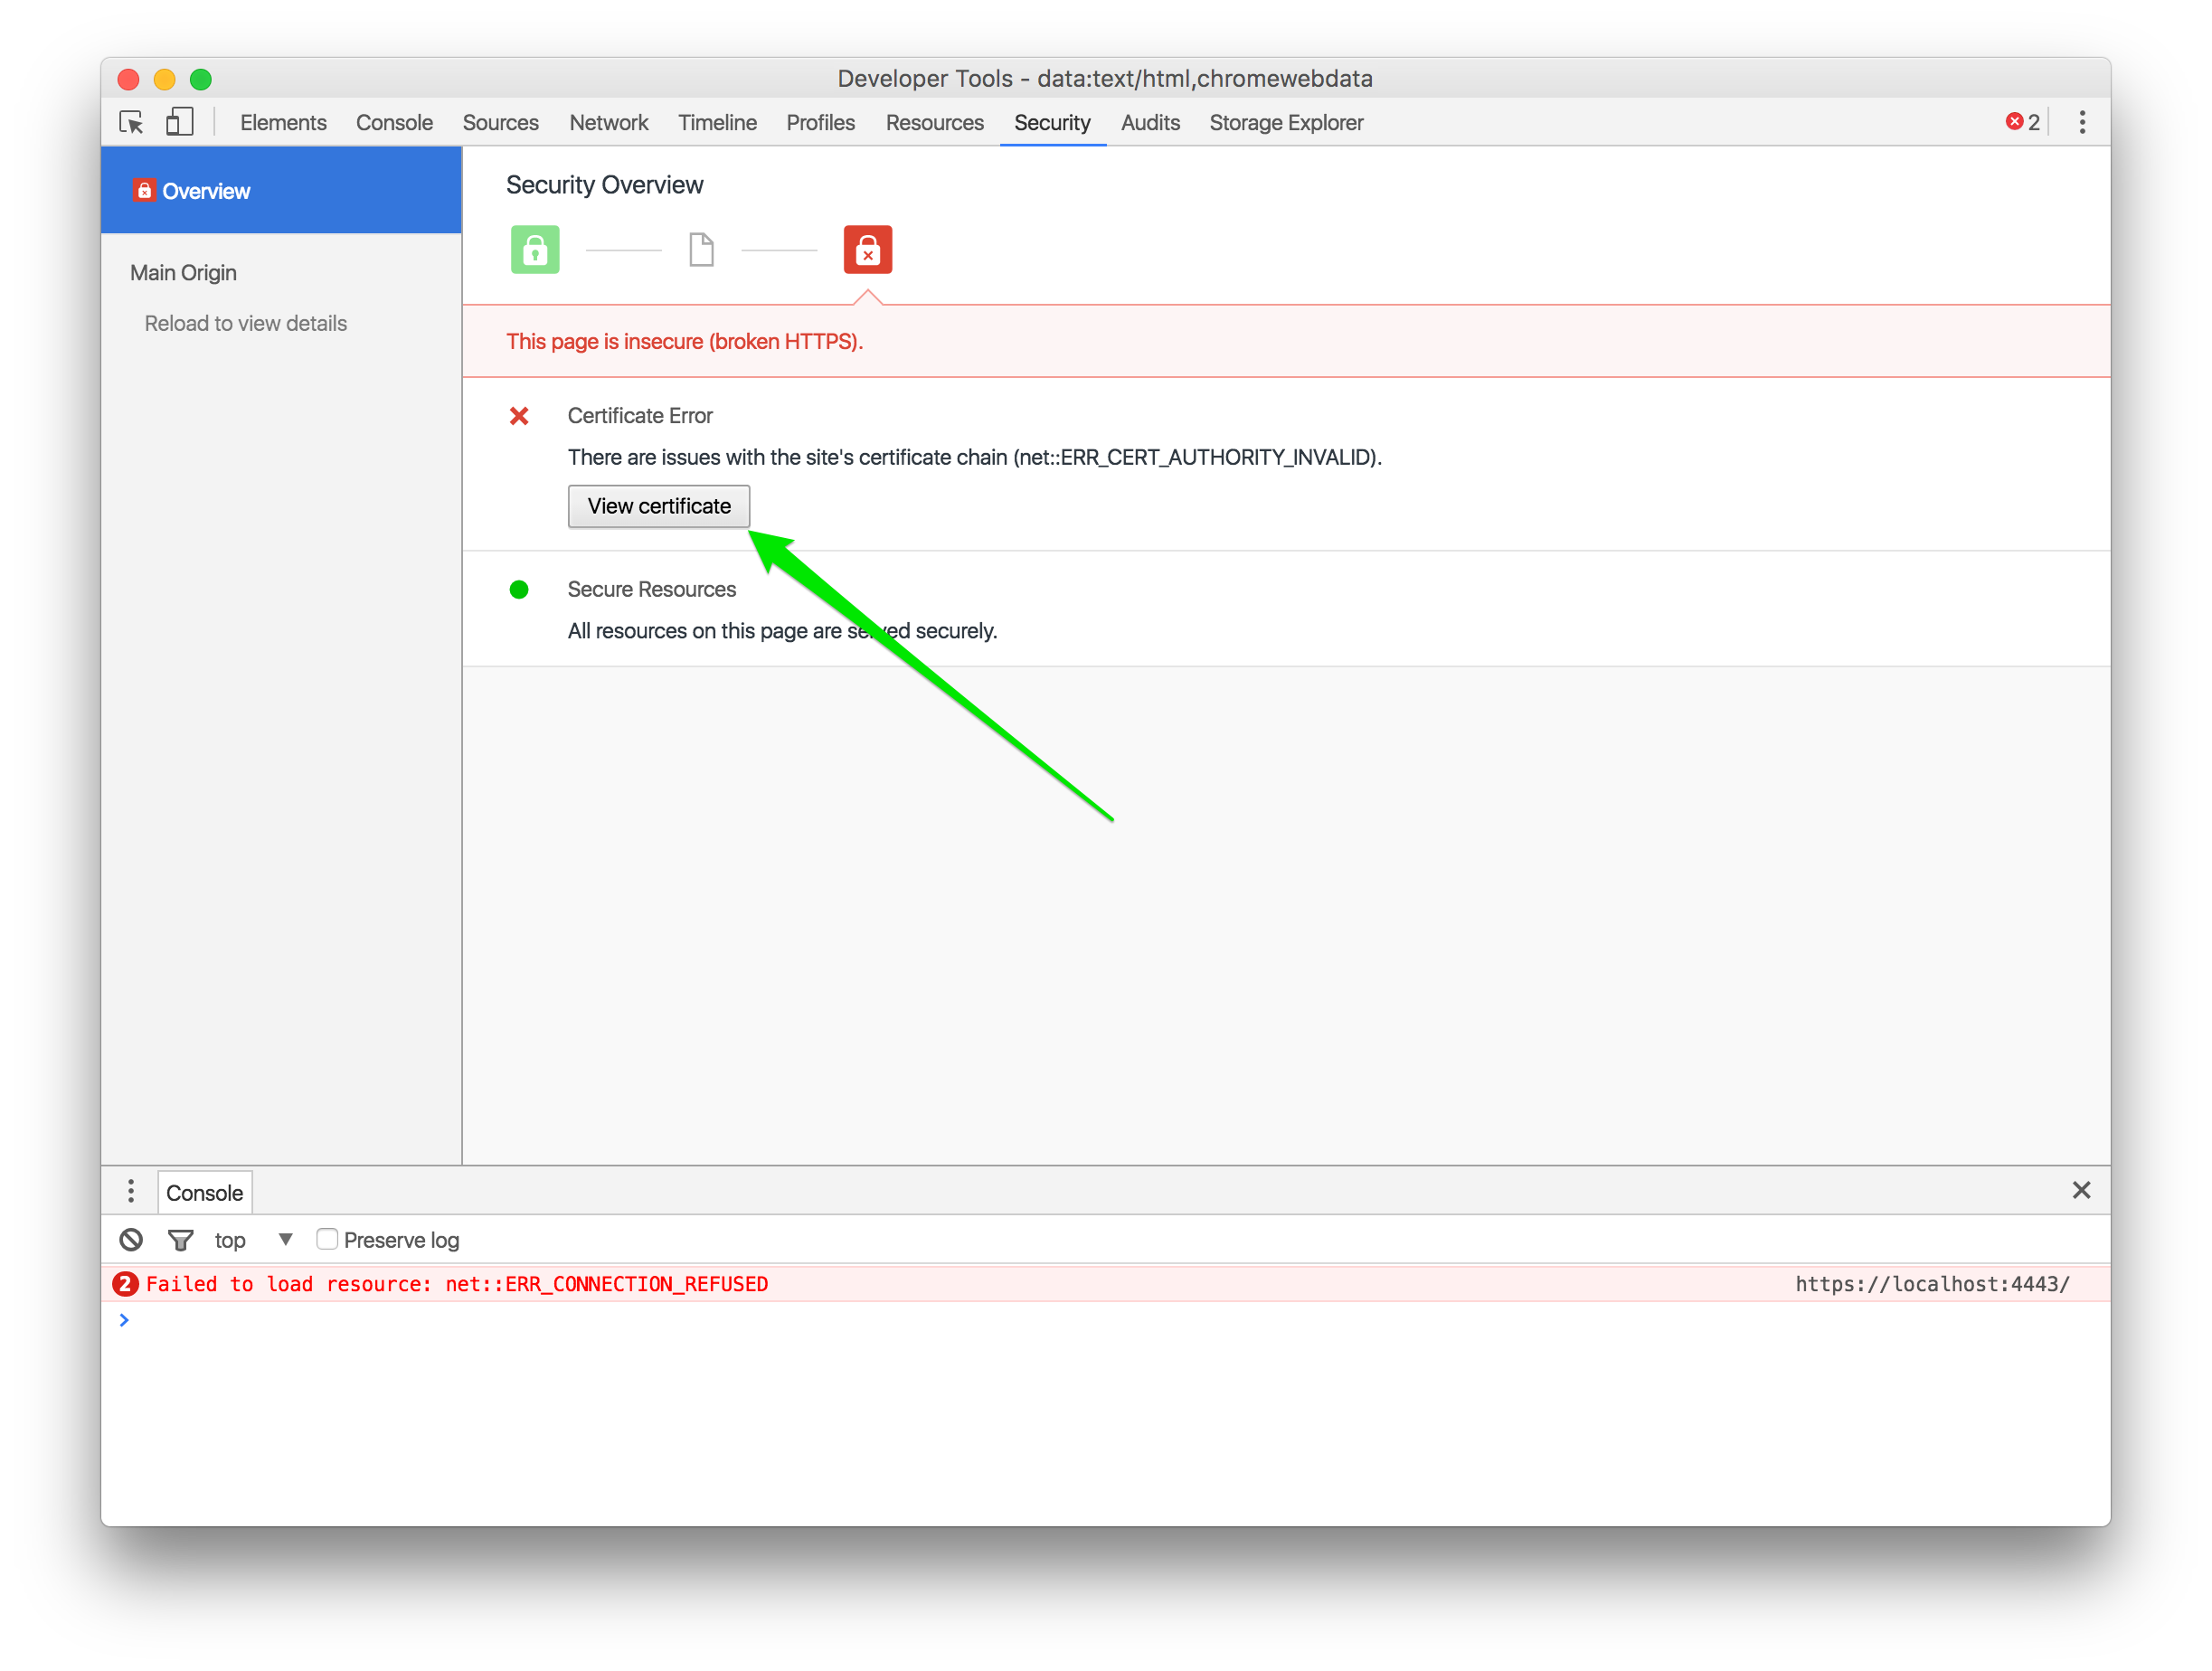
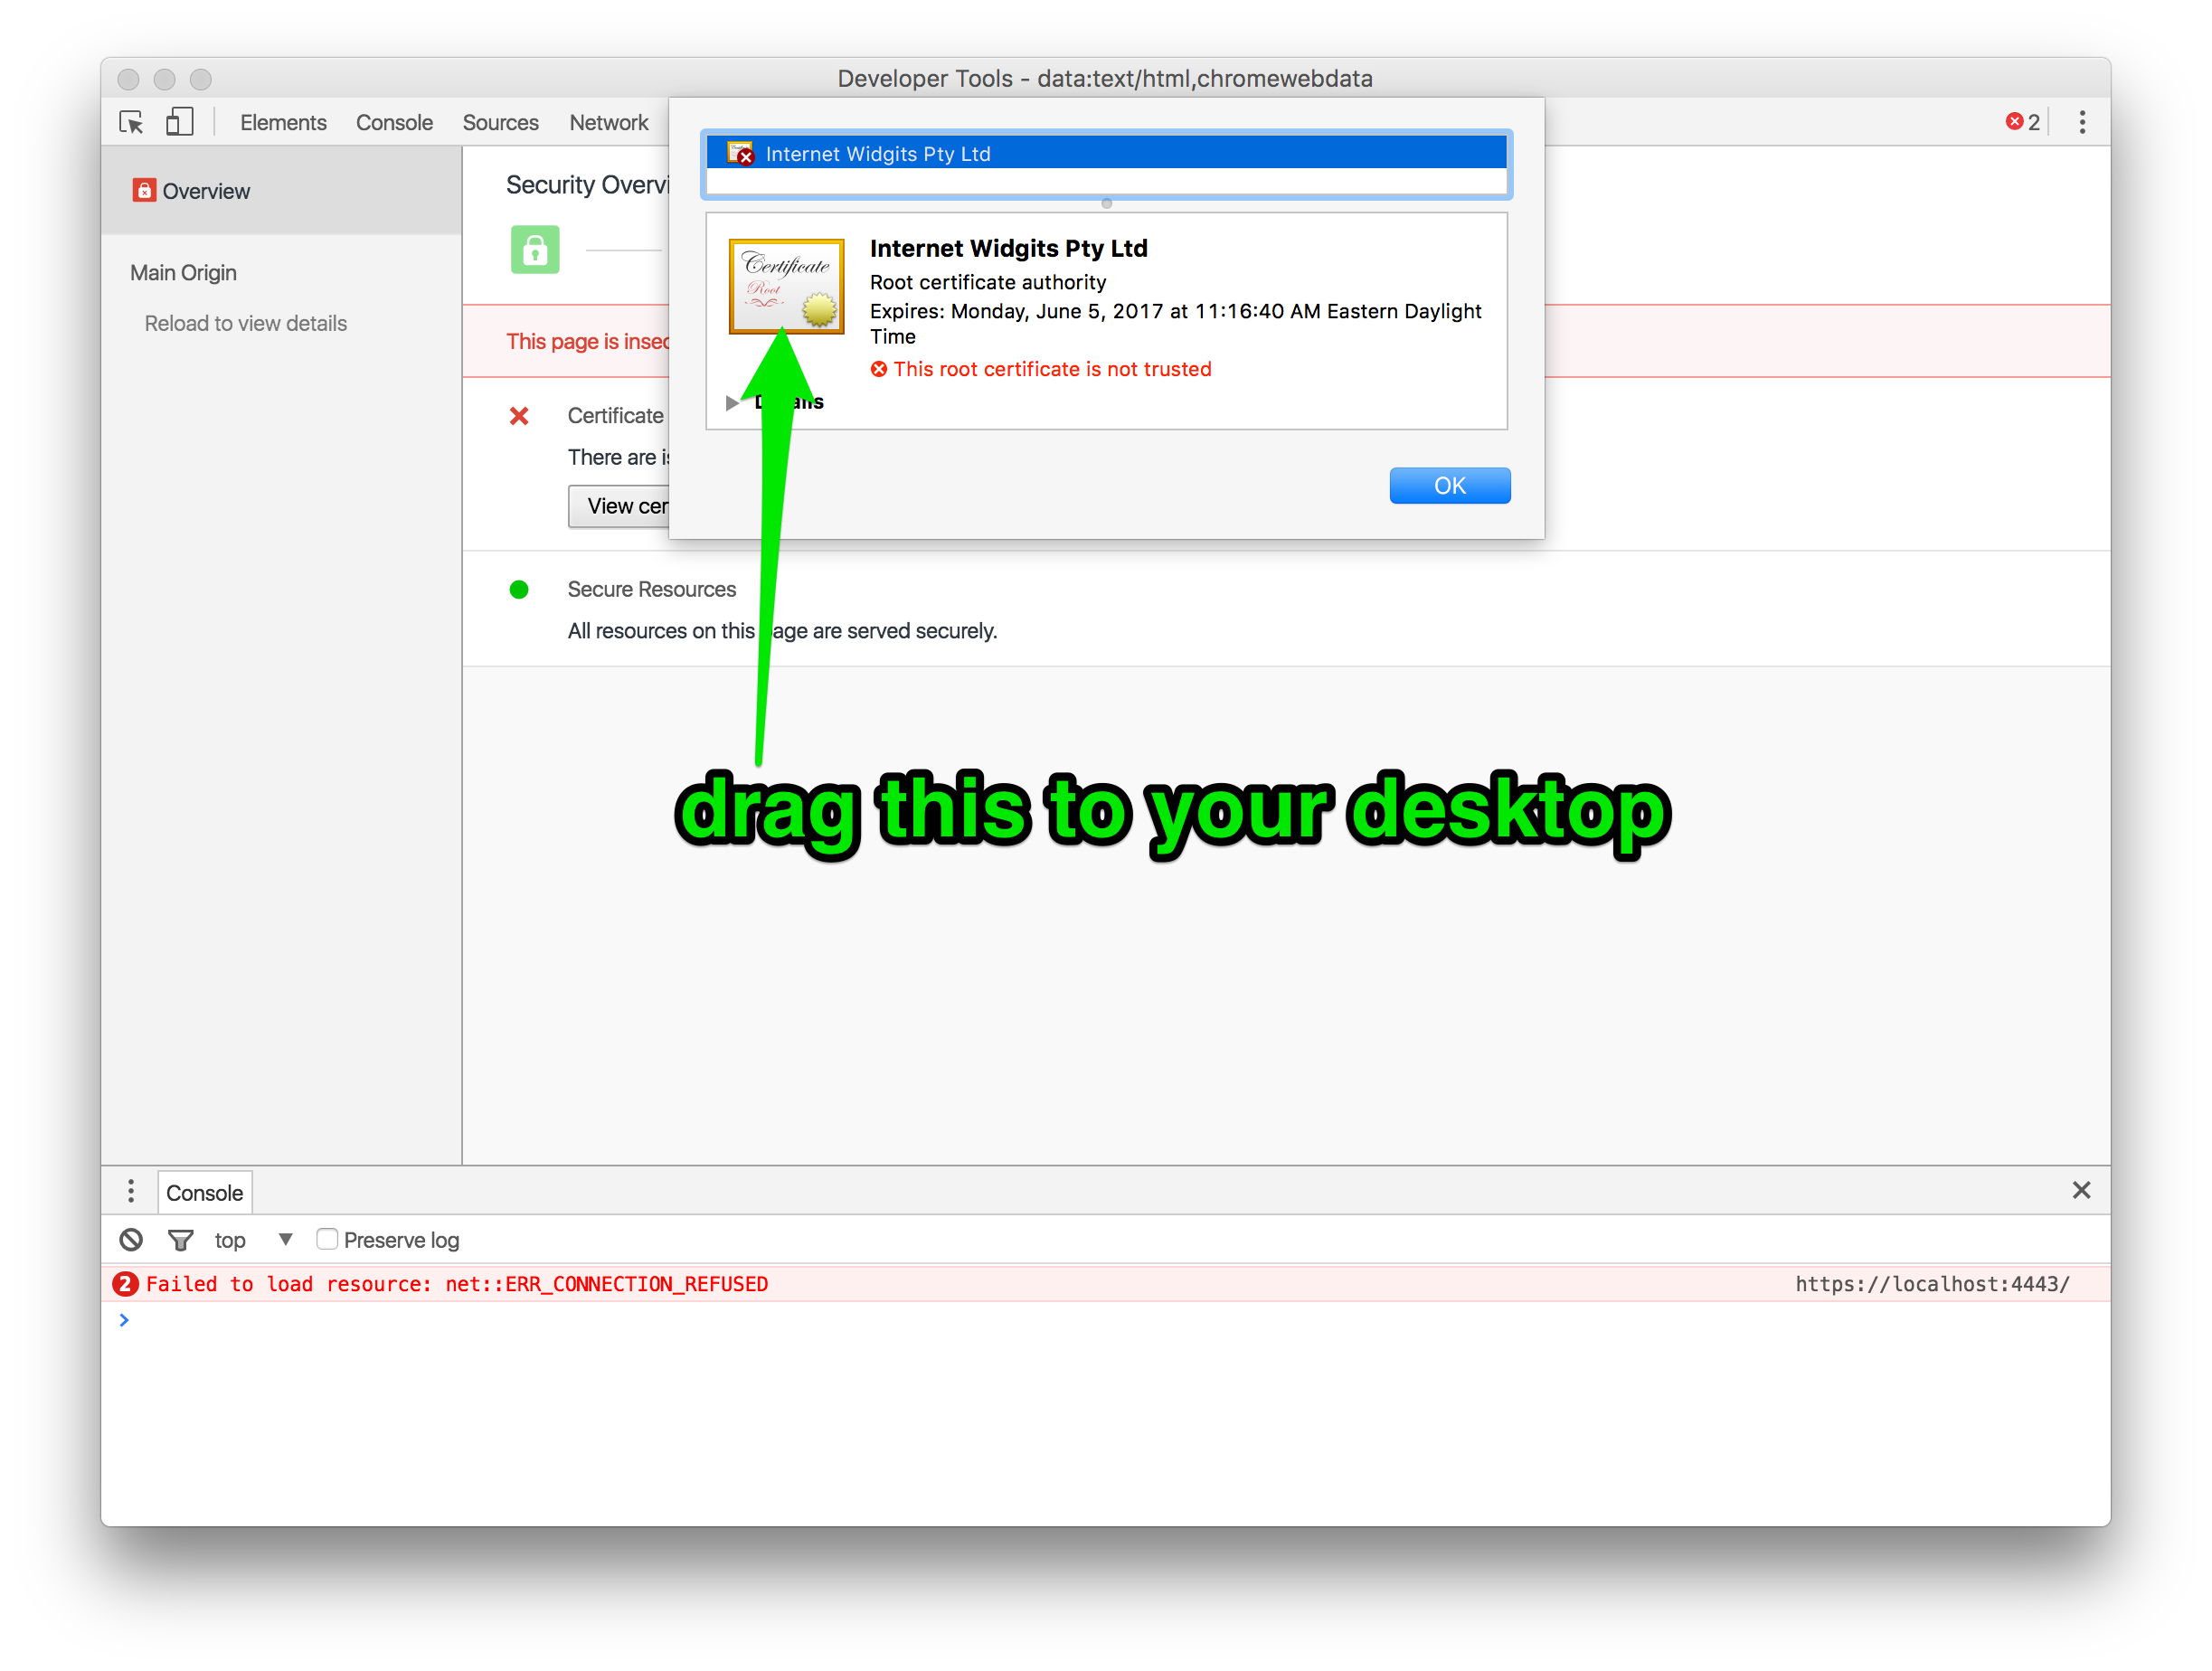
Step 1: Download the .cer file
Open the URL in Chrome. You’ll see the broken lock icon in the address bar; click it. Your goal is to drag the certificate to somplace you can work with it; Chrome will give you a .cer file. (screenshots are small, click to embiggen)
Step 2: convert to .pem, using this in your terminal (and maybe spend a minute with “man openssl” to see what’s up here – we’re converting from one certificate file format to another)
openssl x509 -in server.cer -inform DER -out server.pem -outform PEM
Step 3: Drop the .pem in your app’s assets folder
Step 4a: Here’s how to add that custom cert to OkHttp3
So your designer friend is back and she drops you a hot new design. Due to a branding declaration from a highly-paid branding consultant, your whole app needs to use this new typeface.
Ok, probably not the whole app, just a few titles.
Here’s the catch though — Android doesn’t ship with hot new typefaces like Uptown Sans, so you have to figure out how to convince TextView to render with it. The goal is to make setting the font as easy as every other attribute on a TextView.
Yeah, lint is having none of that; see the highlight? And it’s just going to be ignored by TextView. But hang with me for a couple minutes and you’ll get there.
Step 1. Copy your .otf into your assets folder
Step 2. Copy this class into your project… Build… Breathe… we’re almost there…
We don’t want to go to the effort of rewriting TextView from scratch, it gives us so much. We just want it to accept custom fonts from our layout XML. So we extend. Embrace, extend… embiggen? It’s something like that, I’m pretty sure. Enfranchise? Embark? Empower? Yeah, empower, that has to be it.
Step 3. You need to add this to your attrs.xml, or create res/values/attrs.xml with this if you don’t have one already
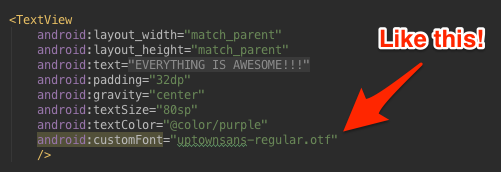
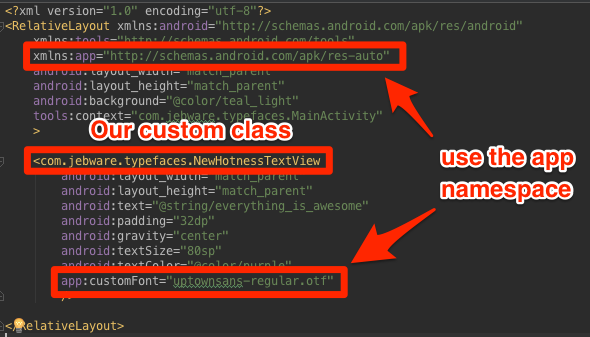
Step 4. Back to the layout file – but with two adjustments
That’s it. Build & run, and you’re done.
Extra Credit.
But wait, you say. DRY that up, right? Yeah, let’s do. You don’t want to have the type in the whole path to the font in every layout file, isn’t that what auto-complete is for? So let’s kick it up a notch. Now I want two weights of that typeface, and the ability to easily reference one or the other.
We need to adjust your attribute to be an enum, instead of a string. Here’s the new version:
Then in the custom TextView, we can dereference those.
And we’re there. See? Not that hard.
Yeah, so…
“There are other ways to do this!”
Agreed. There are others like it, but this one is mine. Tweet @ me with better solutions.
“Why not just use a TextView in the XML and use setTypeface() to change the typeface?”
You totally could. I prefer to keep layout stuff in my layout files for code architecture reasons.
What did I miss? Seriously, tweet @ me. Half of the reason I wrote this article was because this feels like way too much work, so if you’ve got a better solution that I overlooked, I’d love to hear about it.
The best way to fix OutOfMemoryException problems in Android is never to have them, so it’s important to be proactive about limiting the amount of memory that your app uses. Sometimes this means bossing around your designers. Let me explain why with a story…
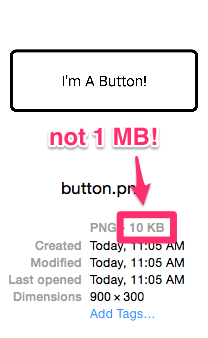
Your designer hands you a design with a PNG that looks like this (well, hopefully your designer hands you things that look nicer than this, since I have no idea what I’m doing, but let’s ignore that for a minute, shall we? K thx.)
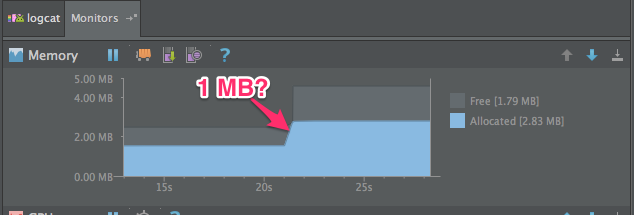
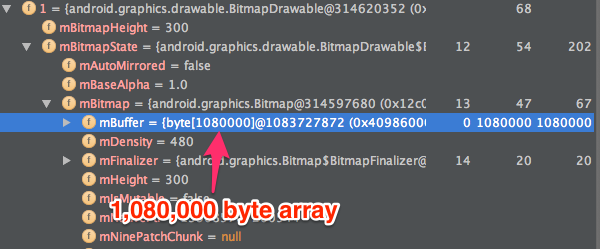
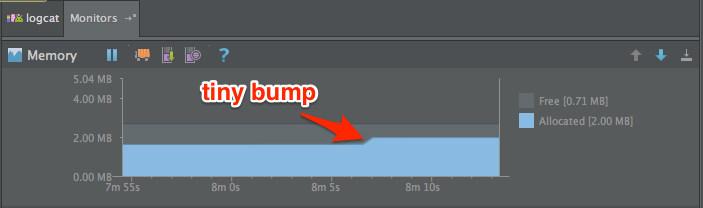
It’s just a little thing, just 300×100 dp. So you lay out the screen, run the app and everything is hunky-dory, until you look at the Memory Monitor in Android Studio and notice your app’s memory usage just jumped by about 1 MB.
What the hell just happened?
That’s no good. Surely adding a simple button can’t cost a megabyte of memory.
You look at the PNG you just added, but it’s only 10KB. That can’t be the problem, can it? Turns out, it is. What you’re looking at in Finder is the compressed image file, but Android doesn’t keep the file compressed when it loads. It renders your PNG to a Bitmap, which is the most un-compressed way to store an image. It’s just a big matrix of pixels with a color value for each pixel. By default, Android uses the ARGB_8888 format which uses 4 bytes per pixel. And oh yeah, we’re looking at an XXHDPI device, so our 300dp width is actually 900 pixels. That means our “little” 900×300 pixel image is using 1,080,000 bytes (1.03 MB) for its Bitmap.
Yeah, that really sucks.
So are you stuck with the sad fact that you’re now 1 MB closer to exploding your app by running out of memory? Do you DM your designer on Slack and tell them they’re a bad person and they’re killing the app? (Pro-tip: don’t ever do that)
There’s a better way. You can draw the same thing to the screen using an XML Drawable and a Button.
Now let’s check that memory usage again.
Our XML-based drawable is using 504 bytes in memory. Oh that’s nice.
Moral of the Story
Now obviously this won’t work for every asset; once you get past basic shapes, you’ll still need assets for anything complex. But by being vigilant, and replacing simple assets with XML drawables, you delay the time when you’ll face the inevitable OutOfMemoryException.
When reading input from an Android user with an EditText, you have a simple way to help that user out by setting the InputType. If you need the user to input a number, for example, you set the number InputType, and the user will automatically key a numeric keypad instead of the full QWERTY. This saves the user a little bit of time and mental energy, and helps avoid mistakes with input.
Beyond just text and numbers, though, are a range of options that produce very subtle changes in the keyboard that Android brings up. Below I explore which options bring up which keypad by default.
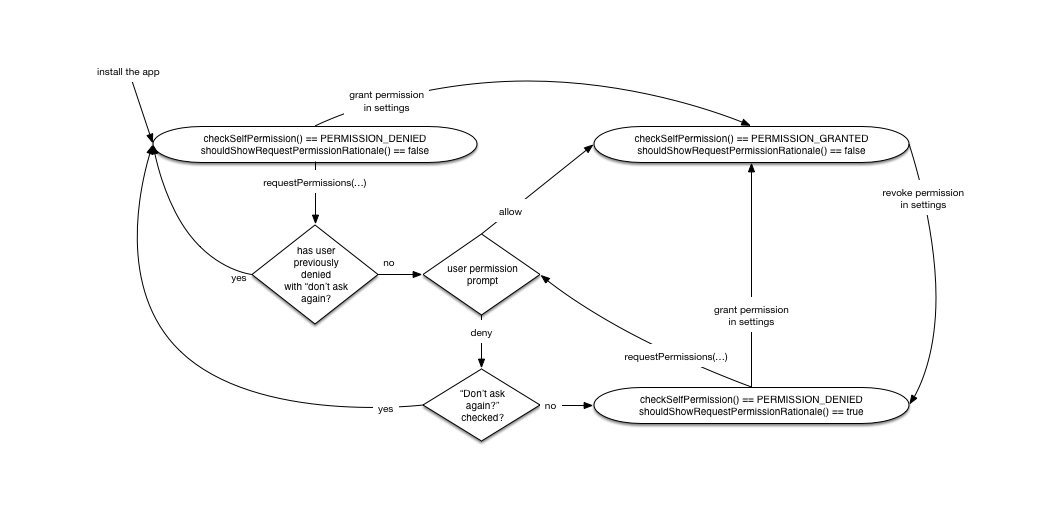 The answer is that if the user revokes a permission in settings, all of that history essentially goes away. You’re left in the same state as if you had asked for permission and the user had denied it once, but you can ask again.
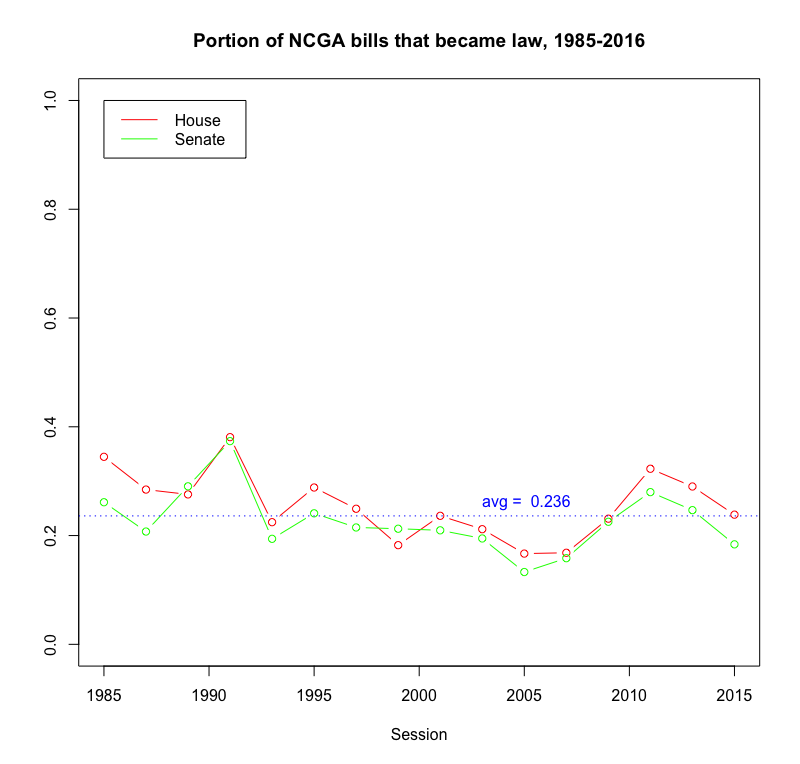


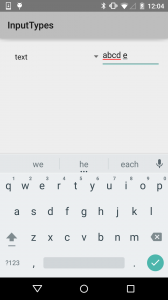 First, the standard keyboard, which covers a lot of the input types.
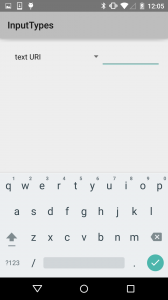 For our first subtle variation, the URI keyboard replaces the comma with a slash.
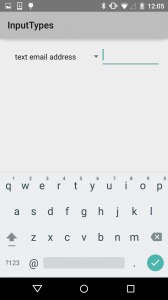 Next, the email keyboard replaces the comma with an @.
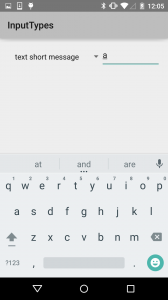 The short message keyboard replaces the enter key with emoji access.
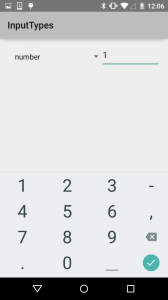 The other main keyboard is for numeric entry.
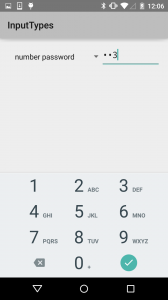 The number password variant reduces the available symbols and focuses just on the numbers.
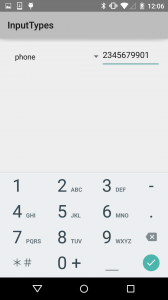 The phone class adds some symbols common for phone number formatting, plus star & hash.
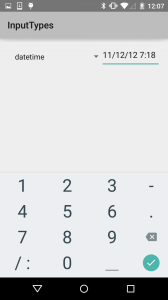 The date/time class gives you a slash and colon for formatting.
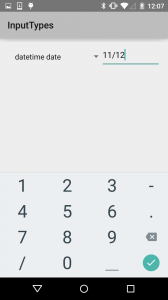 The date variant only allows for a slash.
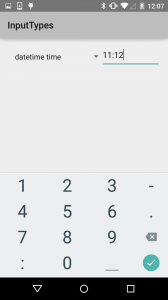 The time variant only allows a colon.