When ProGuard processes an Android app, it generates a few output files to show what happened in each step. These files can be really helpful if you’re trying to figure out what ProGuard changed, or why your code ended up the way it did. But those files aren’t self-documenting, so I’m going to walk you through why each of those files is created and what it shows you.
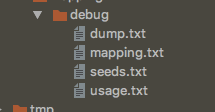
These files are in the build directory, something like:
app/build/outputs/mapping/{buildType}/
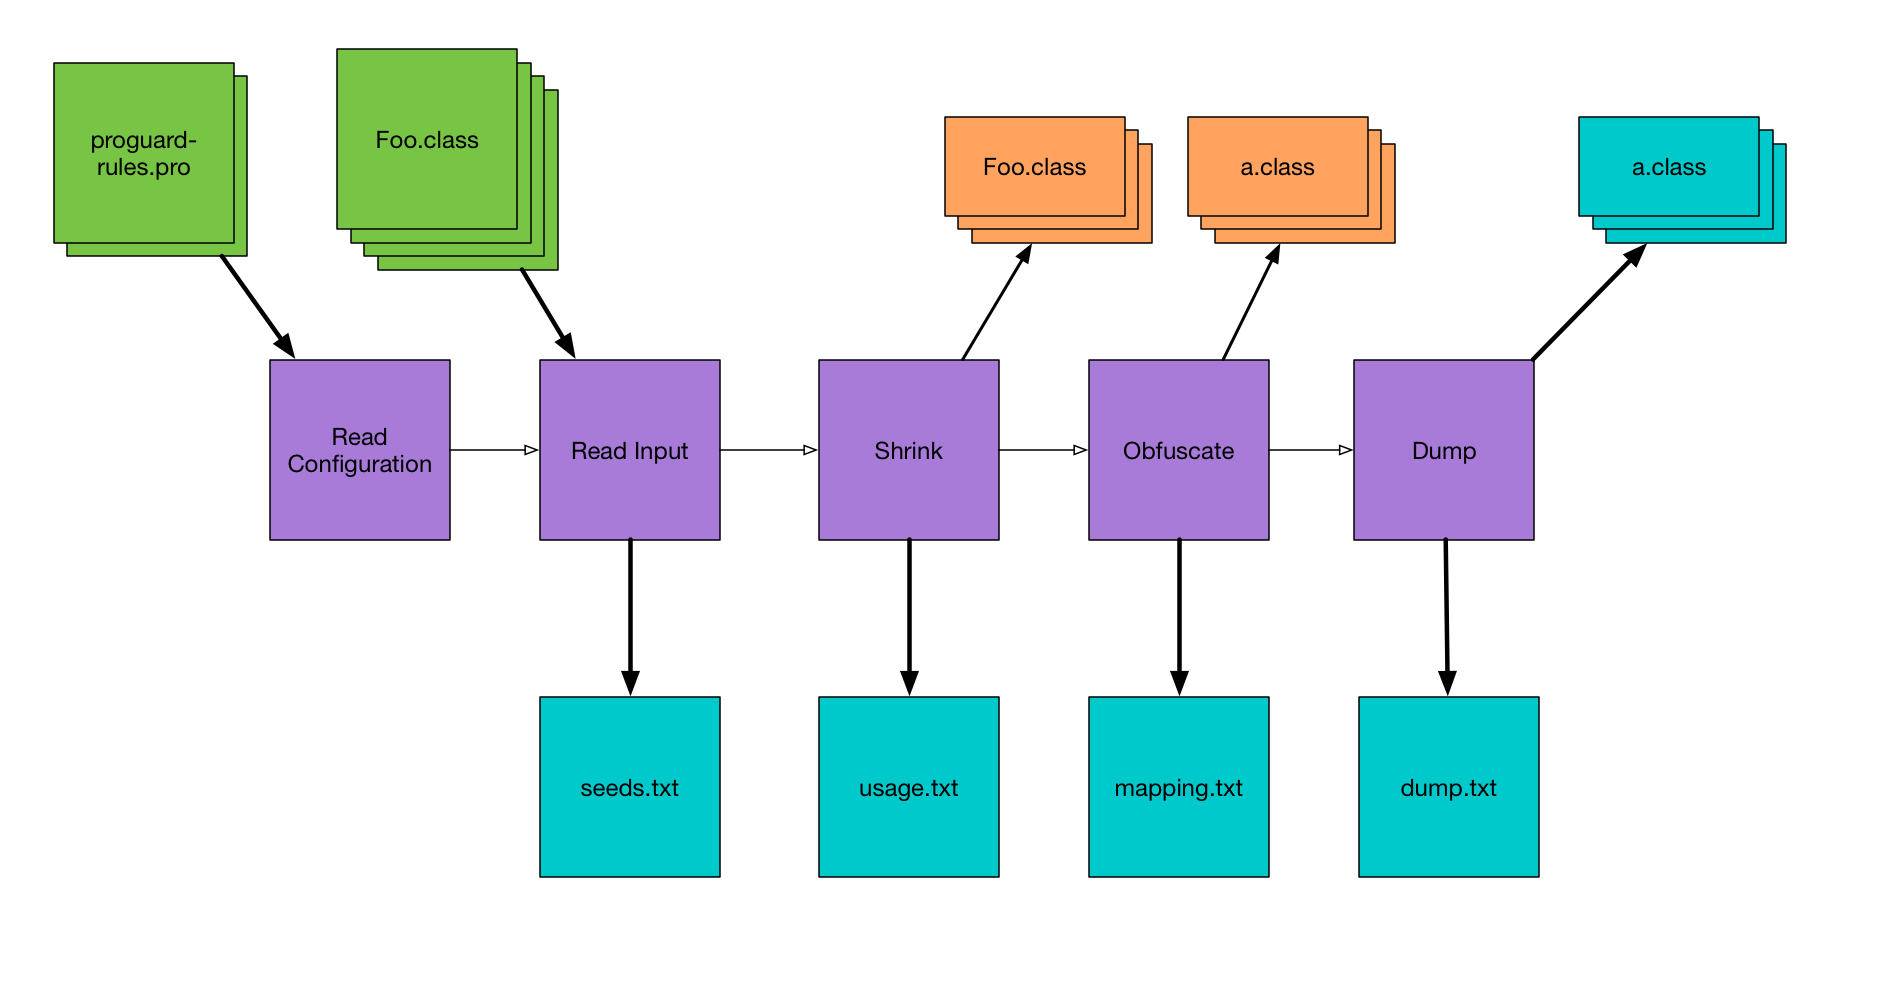
Here’s a diagram I made with a really high-level overview of the steps ProGuard takes when it’s analyzing your app, because the output files line up nicely with these steps. Refer back to this for some context around the following steps.
seeds.txt
The first things ProGuard does is to read all of your configuration files, and then read in all of the Java bytecode (.class files) to create what it calls the class pool. ProGuard then looks through the class pool and prints to seeds.txt a list of every class and member that matches any of your keep rules. This is useful for debugging if the keep rule you wrote actually matches the class you’re trying to keep.
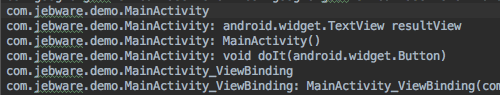
If it’s a class that matches, there will be a line with just the fully-qualified name of the class. For a member, it will be the fully-qualified class name, followed by a colon, followed by the member’s signature.
usage.txt
Knowing what code it has to keep, ProGuard then goes through the class pool and finds code that it doesn’t need to keep. This is the shrinking phase, where ProGuard strips out unused code from the app. As it’s doing this, it prints out unused code — code that’s being removed — to usage.txt. Now this name seems backwards to me; I think it should be unused.txt or shrinkage.txt or something, but that’s just me.
This is useful if you’re trying to figure out why a class doesn’t exist at runtime. You can check whether it got removed here, or got renamed in the next step.
If an entire class is removed, you’ll get a line with the fully-qualified class name. If only certain members of a class are removed, you get the class name followed by a colon, and then a line (indented with four spaces) for each member that was removed.
mapping.txt
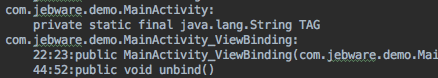
The next thing ProGuard needs to do is obfuscate as much code as possible — that is, it’s going to rename classes and members to meaningless names like “a”, “b”, etc. As it’s doing this, ProGuard prints the old name and new name for every class and member to mapping.txt. Not all code is renamed, but all code is listed in mapping.txt.
This is the file you need if you’re trying to de-obfuscate a stacktrace. It allows you to work backwards from the obfuscated names to the original names of code.
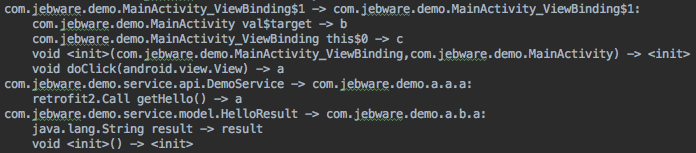
Each line is of the form “{old name} -> {new name}”. You get a line for the class name, then a line for each member of the class. Note that constructors are shown as “<init>()”.
dump.txt
After ProGuard has done all of its magic (shrinking and obfuscating), it prints out one last file which is essentially a full listing of all the code after processing. That is, everything that’s left in the class files, but in a less optimized format, so it’s a huge file. I have a demo app that I use for testing ProGuard stuff, and the final app is about 1 MB, but the dump.txt is almost 18 MB. It’s enormous. Here’s the output for a trivial class:
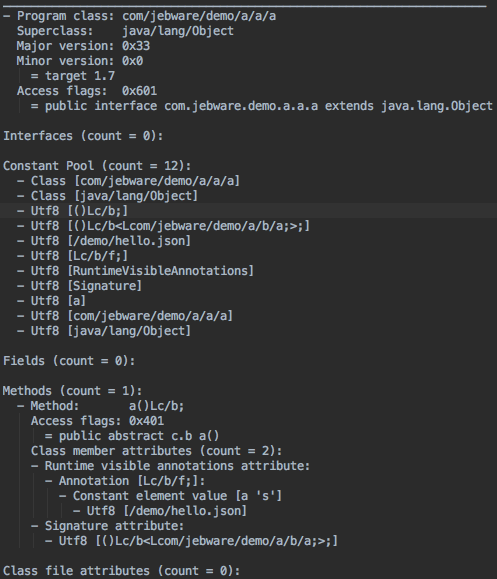
This can be really useful, though, if you want to see what’s in your class files but don’t want to decompile the .class or .dex files.
Archiving
One last note is that these files are important artifacts of your build — especially mapping.txt. If this is a build you’re going to distribute (say on the Play Store, or even internally for testing), you’re going to need your mapping.txt to de-obfuscate stacktraces.