How (often) Does a Bill Become a Law?

[tl;dr — about a quarter of the time]

Every year as state legislative sessions get started, there’s a flurry of scary headlines of the form: “[State] [Party] files bill to do [thing I find scary, bigoted, or irresponsible]”.  It’s tough to know from reading whether this is something you should get concerned about.  

Maybe you should, maybe this is the next big bill that will make your state a national embarrassment, spark economic boycotts, and cause your Governor to lose his re-election campaign.  Or maybe this is a crackpot bill and it’s not going anywhere, so don’t waste your time.  

Good reporting can help to fill this in – is this a senior legislator, are they a known kook, etc.  But there’s another, more general piece of this context that I wanted to help fill in.  My question is, overall: how often does a bill go from being filed (its first official step) to becoming law (its final official step)?

First you need at least a rough understanding of how a legislature works.  You could watch the classic Schoolhouse Rock video:

Or I’ll give you the 60-second version (skip to the next paragraph if you already know how it works): a legislator files a bill, which is a thing that they want to become law.  The person who files is called the “sponsor” or “patron.”  It’s referred to a relevant committee, which is made up of a subset of the legislators in their chamber (the House or Senate, usually).  If a majority of the members of the committee vote for it, then it goes to the full chamber, if it gets a majority vote there then it’s handed over to the other chamber, and the committee and full-chamber process repeats.  After that, the governor signs the bill then it becomes a law.  (Exact details vary by state, but it’s probably pretty close to that, unless you’re in Nebraska.  Find your legislature’s website and they probably have a “how a bill becomes a law” page to explain their version of the process.)

The important thing to know is that bills can (and do) fail at any of those steps in the previous paragraph.  Depending on the rules of the chamber, if the leadership doesn’t like the sponsor, or the bill, it may never even come up for a vote.  Or those votes will happen in a closed session of a subcommittee, where the public doesn’t get to see which legislators voted to kill a bill.

Back to the point, I downloaded the history of every bill filed in the North Carolina General Assembly (NCGA), my state legislature, since 1985 and parsed out its fate.  The answer to my question was 23.6% — just under a quarter of our bills actually become law.  

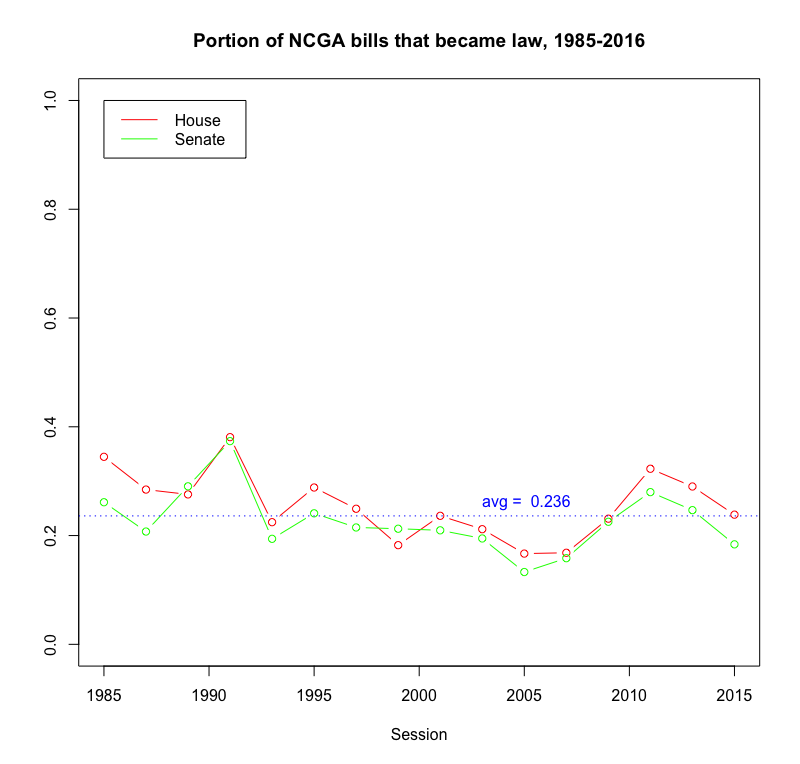
So when you see that scary headline, keep in mind that a bill being filed is actually more likely to fail without becoming law, than to succeed.  I’m not telling you to ignore it, or not to fight it — on the contrary, this should encourage you to fight.  Be part of the reason that the bill you don’t like failed.  Get out there and kill that bill.

I’m sorry, I had to.  I don’t even like this movie, but the pun was just sitting right there.

Since I’ve got all this data, I decided to answer another question quickly: how often does the governor veto bills?  This next chart shows how often, when given the option to sign or veto a bill, the governor chose to veto:

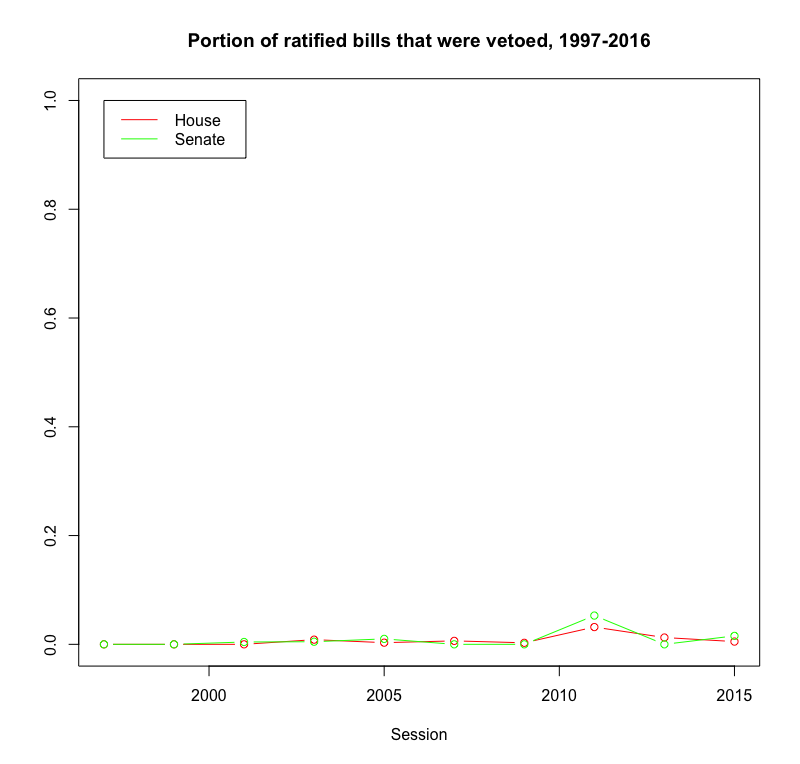
So, uh, not often.  There’s a tiny little spike in the 2011-2012 session, when we had a Democratic governor and a Republican-controlled legislature, but even then it barely registers on the chart.

If you got this far and you think this was at least a little neat, I want to do something for you.  I’ve got all this data downloaded and parsed, and I’m sifting through it, but I want to know what questions I should try to answer.  Here are a few that I want to tackle next:

  • a breakdown of where bills fail – in committee, in the full chamber, in the other chamber.
  • which legislators get more of their bills passed?
  • are bills with more co-sponsors more likely to pass?

Can you come up with others?  If you have a question or a hypothesis, tweet it at me @jebstuart and I’ll see if I can answer it.

Following are a few notes about methodology & assumptions:

Why start in 1985? That’s as far back as the easily-available online records go (and almost my full lifetime) so I’m calling that “the relevant dataset”.  I feel like it’s enough data to get a good sense of the overall pattern.  

Why are there only data points every other year?  The NCGA operates in two-year sessions (e.g. we’re currently in the 2017-2018 session), and that’s how their bills are filed.

What about resolutions?  An NC legislator can file a “bill” or a “resolution”, but resolutions are typically honorary things without legal weight, so I excluded them from the dataset as not relevant to the question I wanted to answer.

What about “extra” (or “special”) sessions?  I didn’t include them either.  They’re typically single-purpose sessions with few bills filed, and I didn’t want to clutter the data.

Are the numbers the same for [other state]? Not the exact same, for sure.  Maybe similar, maybe not.  I have a hunch these results are probably “typical”, within a standard deviation or so, but I can’t verify that without a lot of work that I’m not going to do.

Gerrymandering in NC, or, A Tale of Two States

I moved to North Carolina in 2011 and, as I’ve come to learn more about our politics, I’ve been struck by something that seems impossible: North Carolina has two separate realms of politics.  In statewide elections, NC is split pretty much 50/50 between the two major parties.  But in races where the state is split into districts, like the state legislature, the Republican Party controls a supermajority of seats (over 60%).  With over 60% of the seats in the NC House and Senate, the Republicans can override the Governor’s veto, severely limiting the executive’s power.  

In the first chart are the statewide races – some are won by Democrats, some by Republicans, but they’re all within a couple percent of 50/50.  In the second chart, we see the various districted houses in North Carolina, and all of them have 60+% Republican wins.  I’ve spent much of the last year puzzling over how these two types of elections could produce such different results from the same voters.  My background is in computer science and math, so I’ve tried to find an answer to this question the best way I can: using data.

Our state legisIature, the North Carolina General Assembly (NGCA), is elected every two years, as are our Congressional representatives.  The US President and our statewide offices (Governor, Lieutenant Governor, Attorney General, etc) are every four years, and US Senators are every six years.  So we have a lot of data to work with.  I started by downloading the raw election result data for each of the previously-mentioned races for the last fifteen years from the State Board of Elections.  (Before 2002, the data gets harder to access and less detailed).

What I found is that, before I moved here, elections weren’t quite so lopsided.
Clearly something changed, abruptly, between 2010 and 2012.  I don’t think it was me moving to Charlotte.  More importantly, it wasn’t that the electorate faced a massive shift between parties — if you look at statewide elections, the party splits stayed roughly the same.  There’s some variability as you look at individual races, but you see they’re mostly within the 45-55% range.

So what changed?

These changed.  Following the 2010 census, as happens after each census, district boundaries are redrawn in order to rebalance the shifting population across the districts.  But in 2010, the Republican Party had just won control of the NCGA, so they got to control the redistricting process – the prior maps were drawn by a Democratic Party controlled legislature.

Now it’s important to understand how strategic redistricting works.  If you want to skew the district map to your party’s advantage, you create a small number of districts with as many of your opponent’s voters as you can cram in (“packing”), and a larger number of districts with just enough of your voters to reliably win (“cracking”).  If you’re unfamiliar, I’d recommend taking a minute to read Wikipedia’s primer, which has some helpful examples of why this is so effective.  Also, fun fact, the first district they show as an example of egregious gerrymandering is the district I was in when I first moved to Charlotte, the NC-12th.

In any election, 49% of the votes are “wasted” — that is, they don’t contribute to the election of a candidate.  This includes all of the votes for the losing candidate, and all of the votes for the winner past a simple majority.  If you pack and crack effectively, you can skew the districts so that your party wastes fewer of its votes, and your opponent wastes more of their votes, and you can create a map where a 50/50 citizenry elects a supermajority of one party.  

So the goal of gerrymandering is to waste as many of your opponents votes, and as few of your own votes, as possible.  Let’s see if we notice any change in wasted votes after the 2010 redistricting.  To keep the chart easier to read, let’s start with just one district map – the NC House of Representatives.  Let’s look at the percent of votes that each party wasted.

There it is — a pretty clear jump between close margins in 2002-2010, to very lopsided vote wasting in 2012 and later.  And lest you think I cherry-picked the worst map, I actually chose the least dramatic.  The NC Senate and US House results are even more lopsided.  

In case you’re not a chart person, here’s what that last one says — since 2012, the Congressional maps have been drawn so that over ⅔ of Democrats are wasting their votes, and less than ⅓ of Republicans.  

If you look at all of the elections 2002-2010, the highest percentage of wasted votes that any party had was 59.6% (Republicans in the Senate in 2006).  In every single election 2012-2016, the Democrats have wasted more than that.  It’s impossible for me to overstate that sharp division.  Every single election since 2012 has been more skewed than the worst outlier of the decade before.  Every single election since 2012 has been less fair than all of the elections of the prior decade.  

Back to my original question – how did we end up with 50/50 elections for governor, but a legislature that’s had 60% or more seats go to one party, the same party, in every election since 2012?  The best answer I have for that is to look at the districting.  I believe that the data show that the districts were drawn to systematically favor one party by wasting more of their opponent’s votes.